Retirement Planning
Will my savings last through retirement? Curl Budget's Retirement Planning runs thousands of Monte Carlo simulations with varying market conditions to show you the range of possible outcomes and your probability of success — so you can plan with confidence instead of guessing.
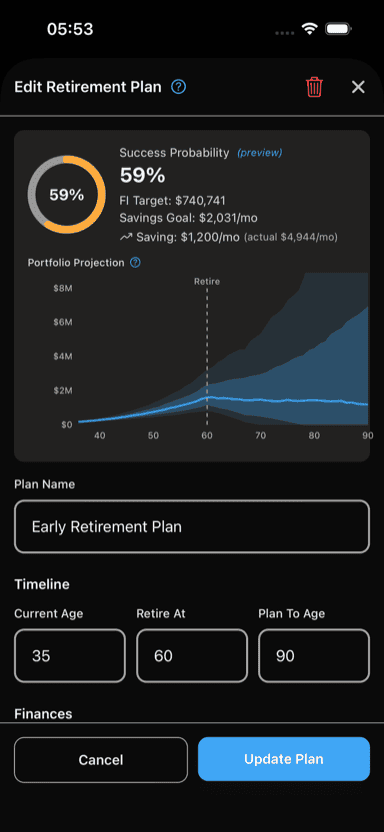
Portfolio projection fan chart showing the range of possible outcomes
[!CAUTION] Important disclaimer Retirement projections are generated by a mathematical model and are not financial advice. Past investment returns are not indicative of future performance. The simulation does not account for all factors that may affect your financial future, including but not limited to: federal and state taxes, Required Minimum Distributions (RMDs), changes to Social Security policy, major medical expenses, long-term care costs, divorce or other family changes, career disruption, housing market fluctuations, or changes in tax law. Results represent statistical probabilities based on historical market patterns and should be used as a planning tool, not a guarantee. Consult a qualified financial advisor for personalized retirement guidance. See our Terms of Service for full details.
[!NOTE] US-centric assumptions The retirement planner currently uses assumptions based on the US financial system, including Social Security benefits, Medicare eligibility at age 65, and US federal tax brackets. If you are outside the US, these defaults may not apply to your situation. You can adjust income sources and retirement ages manually, but tax estimates and government benefit calculations reflect US policy. International retirement planning support is planned for a future release.
How It Works
Retirement plans use a Monte Carlo simulation to model your financial future. Rather than assuming a fixed annual return (which never happens in practice), the simulation runs 1,000 trials where each year's investment return is randomly drawn from a realistic distribution based on your expected return and volatility settings.
Each simulation models:
- Portfolio growth from investment returns (before retirement)
- Inflation-adjusted spending that increases each year
- Social Security and other income sources starting at specified ages
- Withdrawals from your portfolio to cover expenses (after retirement)
- Pre-Medicare healthcare costs during early retirement years
The result is a probability-based picture of your retirement readiness rather than a single optimistic or pessimistic guess.
Key Results
When you create or edit a retirement plan, you'll see three key numbers:
Success Probability
The percentage of simulations where your portfolio lasted through your planned retirement. The gauge is color-coded:
- Green (80%+) — On track. Most financial planners consider 80%+ a strong plan.
- Yellow (50%–80%) — Worth attention. Adjusting savings, timing, or spending could improve your odds.
- Red (below 50%) — Less than a coin flip. Consider saving more, working longer, or reducing planned spending.
FI Target
Your Financial Independence target is the portfolio size needed to sustain your planned retirement spending indefinitely at a 4% annual withdrawal rate — a widely used rule of thumb in financial planning. This number is always calculated using the 4% rule regardless of which withdrawal strategy you select; the strategy only affects how the simulation models actual withdrawals. The formula accounts for your expected retirement spending (adjusted by your expense ratio) minus guaranteed income like Social Security. This gives you a concrete number to work toward.
Savings Goal
If your current savings haven't reached the FI target, Curl Budget calculates how much you'd need to save each month to reach 80% success probability — the industry-standard benchmark for being "on track." This number is found by running additional Monte Carlo simulations at different savings levels until the one that achieves 80% success is identified. If you're already saving at or above the goal, it appears in green on your plan card.
Portfolio Projection Chart
Below the success gauge, a fan chart visualizes how your portfolio might evolve over time. The chart shows your age on the horizontal axis and portfolio value on the vertical axis.
Reading the Chart
- Light shaded area — The range between the 10th and 90th percentile. 80% of simulations fell within this band. The outer edges represent unusually good or bad market outcomes.
- Darker shaded area — The range between the 25th and 75th percentile. Half of all simulations fell within this narrower band, representing the most likely range of outcomes.
- Solid line — The 50th percentile (median). Half of simulations ended above this line and half below.
- Dashed vertical line — Your planned retirement age. Before this line, your portfolio grows from contributions and returns. After it, withdrawals begin.
A wider fan means more uncertainty. If the bottom of the light band stays above $0 through your plan-to age, most scenarios sustain your retirement. If the bands collapse toward $0 early, the plan may need adjustment.
Why There Is Uncertainty
No one can predict future investment returns. The spread of outcomes in the chart reflects real sources of uncertainty:
- Market volatility — Stock and bond returns vary dramatically year to year. A few bad years early in retirement can permanently reduce your portfolio (sequence-of-returns risk).
- Inflation — Higher-than-expected inflation erodes purchasing power and forces larger withdrawals.
- Longevity — Living longer than planned means more years of withdrawals.
- Spending changes — Healthcare costs, lifestyle changes, or unexpected expenses can increase spending beyond what was planned.
Methodology
Monte Carlo Simulation
The simulation runs 1,000 independent trials of your retirement plan. In each trial, every year's investment return is randomly generated from a normal distribution defined by your expected return and volatility settings (using the Box-Muller transform). This produces a realistic spread of outcomes — some trials experience strong early returns, others hit bear markets at the worst time.
Each trial simulates your portfolio year by year:
- Pre-retirement years: The portfolio grows by the randomly generated annual return, plus your inflation-adjusted monthly contributions.
- Retirement years: The portfolio still earns returns, but withdrawals begin. The simulation calculates inflation-adjusted spending (minus any income from Social Security, pensions, or other sources) and deducts that from the portfolio. If you've configured pre-Medicare healthcare costs, those are included until Medicare age.
- Outcome: If the portfolio balance stays above zero through your planned age, the trial is a success. If it hits zero early, it's a failure.
Success Probability
The success probability is simply the fraction of trials where your portfolio survived:
Success % = (trials that lasted through your plan-to age) / 1,000
Because each trial uses different randomly generated returns, this gives you a probability distribution rather than a single deterministic answer. With 1,000 trials, the result is statistically stable — running the simulation again will produce a very similar probability.
Savings Goal Calculation
The savings goal uses a binary search algorithm to find the monthly savings amount that achieves 80% success. It runs additional Monte Carlo simulations (200 trials each) at different savings levels, narrowing the range until it finds the amount where roughly 80% of trials succeed. This typically converges within 15–20 iterations to within $10/month precision.
Statistical Assumptions
The simulation makes several simplifying assumptions:
- Returns are normally distributed: Annual returns are drawn from a bell curve. Real markets exhibit heavier tails (more extreme events) than a normal distribution predicts, meaning actual worst-case scenarios can be more severe than the simulation suggests.
- Returns are independent: Each year's return is generated independently. In reality, markets sometimes exhibit momentum or mean-reversion patterns.
- Constant parameters: Inflation, expected return, and volatility remain fixed throughout the simulation. In practice, these shift over decades.
- Spending grows with inflation: Real expenses can be lumpier — large one-time costs (home repairs, medical events) aren't captured.
- No taxes: The simulation operates on pre-tax balances and does not model federal, state, or capital gains taxes, or Required Minimum Distributions.
- No behavioral changes: The simulation doesn't account for changes in spending behavior, asset allocation shifts over time, or dynamic withdrawal adjustments beyond the two built-in strategies.
Default Parameters
The default values reflect commonly cited long-term averages:
| Parameter | Default | Basis |
|---|---|---|
| Expected return | 7% | Approximate long-term nominal return of a diversified stock portfolio |
| Volatility | 15% | Approximate historical standard deviation of annual stock returns |
| Inflation | 2.5% | Near the Federal Reserve's 2% target, with a small margin |
| Withdrawal rate | 4% | Based on the "Trinity Study" (1998) safe withdrawal rate research |
| Success target | 80% | Widely used industry benchmark for "on track" retirement readiness |
These defaults are starting points. Your actual portfolio mix, tax situation, and risk tolerance may warrant different assumptions.
What Improves Your Odds
Several levers can improve your success probability:
- Save more now — A larger starting balance provides a bigger cushion against bad markets.
- Delay retirement — More years of saving and fewer years of withdrawals.
- Reduce spending — Lower annual withdrawals make your portfolio last longer.
- Delay Social Security — Claiming later increases your guaranteed monthly income, reducing portfolio strain.
- Use variable withdrawals — Spending less in down markets preserves capital for recovery.
Creating a Retirement Plan
- Go to Organize → Retirement tab
- Tap the + button
- Enter your plan details:
- Plan Name (e.g., "Early Retirement Plan")
- Current Age, Retire At, and Plan To Age
- Current Retirement Savings — Your total retirement portfolio today
- Annual Spending — How much you spend per year (or tap Use estimate to pull from your transaction history)
- Tap Create Plan
Your plan is created with sensible defaults: 7% expected return, 2.5% inflation, 15% volatility, and a fixed 4% withdrawal strategy. You can customize all of these in the Advanced Assumptions section when editing the plan.
Configuring Your Plan
Tap any plan to open the editor. Settings are organized into sections:
Timeline
- Current Age — Your age today
- Retire At — When you plan to stop working
- Plan To Age — How long you want your plan to cover (your life expectancy estimate)
Finances
- Current Retirement Savings — Total saved for retirement across all accounts
- Annual Spending — Your current annual spending in today's dollars. The simulation adjusts this for inflation each year.
Income Sources
Expand this section to configure post-retirement income:
Social Security
- Monthly Amount — Your expected monthly benefit (default: $1,800). Tap the help icon for guidance on estimating your benefit, or visit ssa.gov/myaccount for a personalized estimate.
- Start Age — When you plan to start collecting (62–70). Claiming later increases your benefit by roughly 8% per year past your Full Retirement Age (67 for most people).
Other Post-Retirement Income
- Amount (Annual) — Pension, part-time work, rental income, or other regular income
- End Age — When this income stops (leave blank for lifetime)
Advanced Assumptions
Expand this section to fine-tune the simulation parameters:
| Setting | Default | Description |
|---|---|---|
| Expected Return | 7% | Average annual portfolio growth rate |
| Volatility | 15% | Standard deviation of annual returns (higher = more variability) |
| Inflation | 2.5% | Annual inflation rate applied to spending |
| Expense Ratio | 100% | Percentage of current spending you expect in retirement |
| Withdrawal Strategy | Fixed 4% | How you draw from your portfolio (see below) |
| Pre-Medicare Healthcare | Optional | Annual healthcare cost before Medicare eligibility |
| Medicare Age | 65 | When Medicare coverage begins |
Withdrawal Strategies
Two strategies are available. Both use the 4% rate as a reference point, but apply it differently:
- Fixed — Withdraws whatever is needed to cover your inflation-adjusted expenses minus income, regardless of portfolio performance. Simple and predictable, but doesn't adapt to market conditions. Called "fixed" because your spending plan stays constant.
- Variable — Caps withdrawals at 4% of your current portfolio balance. If your expenses exceed 4% of the portfolio, you withdraw only 4%, effectively reducing spending. In down markets, you spend less, which preserves capital for recovery. This generally improves portfolio longevity but means your spending may fluctuate year to year.
Tips for Better Results
Start with Your Real Spending
Use the Use estimate button when creating a plan. It analyzes your last 12 months of transactions (excluding transfers and duplicates) to give you an accurate baseline. A realistic spending number is the single most important input.
Test Different Scenarios
Create multiple plans to compare strategies:
- "Retire at 60" vs. "Retire at 65" — See how 5 extra years of saving affects your odds
- Conservative (5% return, 20% volatility) vs. Moderate (7% return, 15% volatility) — Understand how market assumptions change outcomes
- High spending vs. Reduced spending — Find the spending level where your plan hits 90%+
What Does 100% Mean?
A 100% success probability means every simulation survived — which often reflects very conservative spending or a large portfolio. Whether that's the right target depends on your personal risk tolerance and goals. Most financial planners consider 80%–90% a strong target that balances confidence with flexibility. The gauge turns green at 80% and the savings goal targets that benchmark, but there's nothing wrong with aiming higher if it fits your situation.
Review Annually
Your plan's inputs change over time — salary increases, spending habits shift, market conditions evolve. Revisit your plan at least once a year and update your current savings and spending.
Limitations
Like all financial models, retirement planning is a simplification. The simulation does not account for many real-world factors, including but not limited to:
- Taxes — Federal income tax, state taxes, capital gains, and Required Minimum Distributions (RMDs) are not modeled. Your actual withdrawals may need to be larger to cover tax obligations.
- Extreme market events — Returns are modeled as normally distributed, which captures typical market behavior but underestimates the likelihood of severe crashes or prolonged recessions.
- Healthcare beyond the gap — Only pre-Medicare healthcare costs are modeled. Medicare premiums, supplemental insurance, long-term care, and out-of-pocket costs after 65 are not included.
- Social Security changes — Benefits are modeled at a fixed monthly amount and do not account for potential future benefit reductions, means-testing, or policy changes.
- Life changes — Divorce, disability, inheritance, career disruption, relocation costs, and family support obligations are not modeled.
- Inflation variability — A single constant inflation rate is applied. Actual inflation varies by category (healthcare inflation typically exceeds general inflation) and by year.
- Estate and legacy planning — The simulation only asks whether your portfolio lasts through your plan-to age, not whether anything remains for heirs.
Past investment returns are not indicative of future performance. Use the results as a directional planning tool, not as a prediction or guarantee of any specific outcome. For personalized advice that accounts for your complete financial picture, consult a qualified financial advisor.
Related Features
- Goals - Track progress toward savings goals
- Cash Flow Report - Understand your income vs. spending to inform retirement assumptions
- Budgeting - Control spending to increase your savings rate
- Accounts - Monitor the accounts that fund your retirement