Cash Flow Report
The Cash Flow report is your primary view for understanding the flow of money through your finances. It shows income and expenses over time as an overlapping area chart, giving you a clear picture of your financial health.
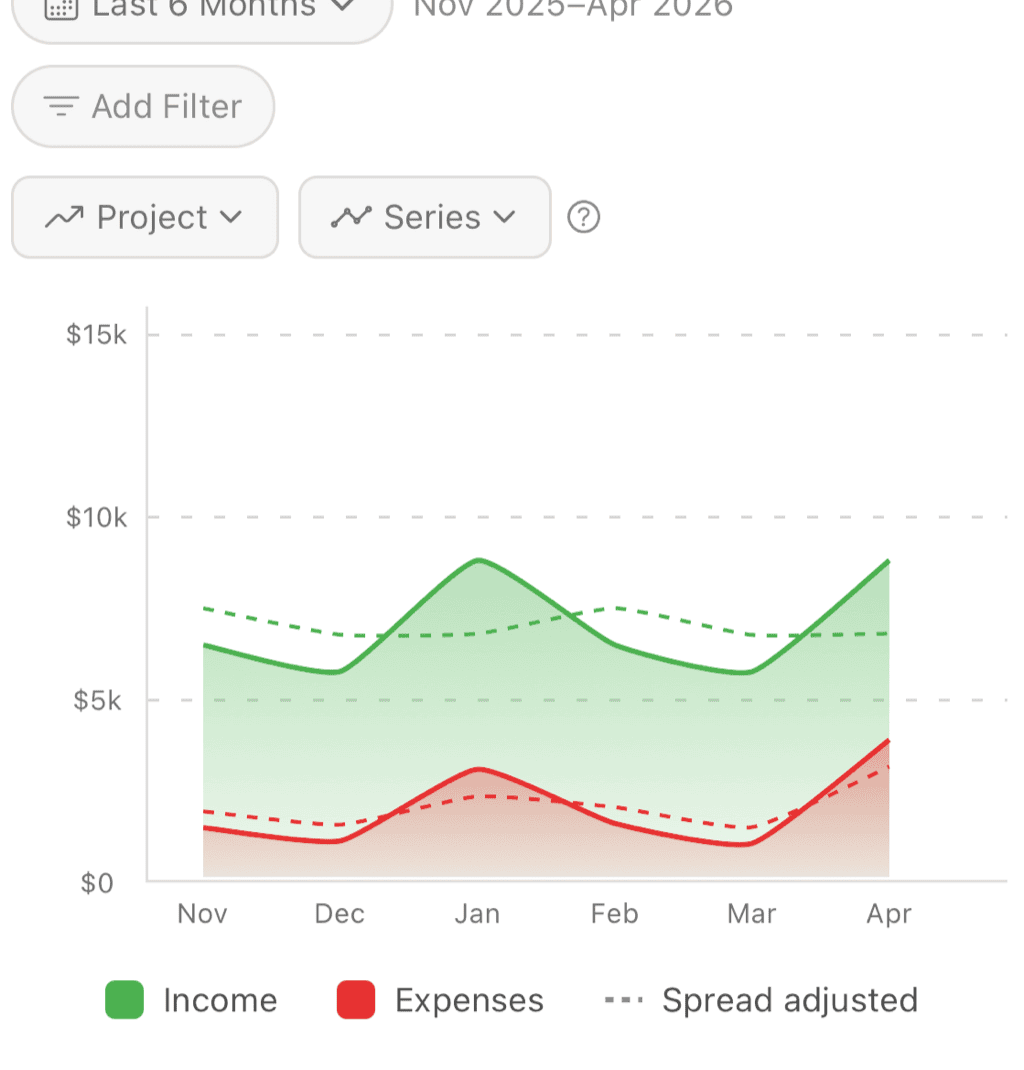
Income (green) and expenses (red) over 6 months, with spread-adjusted trend line
Understanding the Chart
The Visualization
The Cash Flow chart displays:
- Income area (typically green) - Money coming in
- Expense area (typically red/orange) - Money going out
- Overlap - Where income and expenses meet
- Time axis - Days, weeks, or months depending on date range
Reading the Chart
Above the expense line = Net positive
- You're earning more than spending
- Money is accumulating
Expense exceeds income = Net negative
- Spending more than earning
- Drawing down savings or going into debt
Net Cash Flow
The difference between income and expenses:
Net Cash Flow = Income - ExpensesA positive net cash flow means you're saving money. A negative net cash flow means you're spending more than you earn.
Date Ranges
Preset Ranges
Quick access to common views:
- This Week - Current week's activity
- This Month - Current calendar month
- Last Month - Previous calendar month
- This Quarter - Current quarter (3 months)
- This Year - January 1 to today
- Last Year - Previous calendar year
Custom Ranges
Select any start and end date for:
- Specific billing cycles
- Project periods
- Year-over-year comparisons
- Any custom analysis
Comparison View
Compare two periods side by side:
- This month vs. last month
- This quarter vs. same quarter last year
- Any two periods of equal length
Chart Details
Aggregation
Data is aggregated based on your date range:
| Date Range | Aggregation |
|---|---|
| Under 1 month | Daily |
| 1-3 months | Weekly |
| Over 3 months | Monthly |
This keeps the chart readable regardless of the time period.
Hovering/Tapping
Interact with the chart to see:
- Exact income for that period
- Exact expenses for that period
- Net cash flow
- Date range for the data point
Scrolling and Zooming
- Swipe to pan through time
- Pinch to zoom in/out
- Double-tap to reset view
What's Included
Income
Transactions categorized as income:
- Salary/wages
- Freelance payments
- Investment income
- Refunds (if categorized as income)
- Any category marked as "income"
Expenses
All non-income, non-transfer transactions:
- Regular purchases
- Bills and subscriptions
- Cash withdrawals (if not excluded)
- Any spending transaction
Excluded from Reports
The following don't appear in Cash Flow:
- Moving money between your own accounts
- Credit card payments
- Internal transfers
- Only the shown copy counts
- Duplicates don't inflate totals
Excluded Accounts
- Accounts you've chosen to exclude
- Hidden accounts
Filtering the Report
By Account
Focus on specific accounts:
- "Show only checking account"
- "Exclude investment accounts"
- "Compare between accounts"
Useful for seeing cash flow per payment method or account type.
By Category
Focus on specific spending areas:
- "Show only Food & Dining"
- "Exclude one-time purchases"
Note: This affects both income and expenses based on categories.
By Tag
Focus on tagged transactions:
- "Show only business expenses"
- "Track project spending over time"
Combines with other filters for detailed analysis.
Budget Integration
Budget Lines
When viewing Cash Flow, you can overlay budget information:
Budget limit line
- Shows your budgeted expense level
- Compare actual spending to budget
- See if you're on track over time
Cumulative budget tracking
- For monthly budgets: daily budget accumulation
- Visual comparison of actual vs. expected
Budget Line Styling
The budget line appearance indicates confidence level:
Solid budget line - Exact budget amount known
- Direct filter-to-budget match (e.g., filtering by "Restaurants" with a "Restaurants" budget)
- High confidence in the displayed amount
Dashed budget line - Estimated budget amount
- Budget is inferred from historical transaction patterns
- Indicates some uncertainty in the calculation
Budget range (shaded band) - When upper and lower bounds differ
- Shows the range of possible budget values
- Wider band = more uncertainty
Budget and Series Mode
When using spread transactions, the budget calculation depends on which series you're viewing:
| Series Mode | Budget Calculation |
|---|---|
| Actual | Based on actual transaction amounts |
| Both | Based on actual transaction amounts |
| Spread Adjusted | Based on spread-adjusted amounts |
In "Actual" or "Both" mode, the budget line matches your actual spending patterns. In "Spread Adjusted" mode, the budget reflects the smoothed, distributed amounts—ensuring the budget line always aligns with the primary data being displayed.
Implied Budgets
When filters are applied, budget lines adjust intelligently based on:
- Filtering by account (budgets span all accounts)
- Filtering across budget dimensions
- Using tag filters with category budgets
See Implied Budgets for details on how this works.
Projected Cash Flow
You can project the Cash Flow chart into the future with projected income and expense lines. These projections help you anticipate upcoming months based on your actual spending and earning patterns.
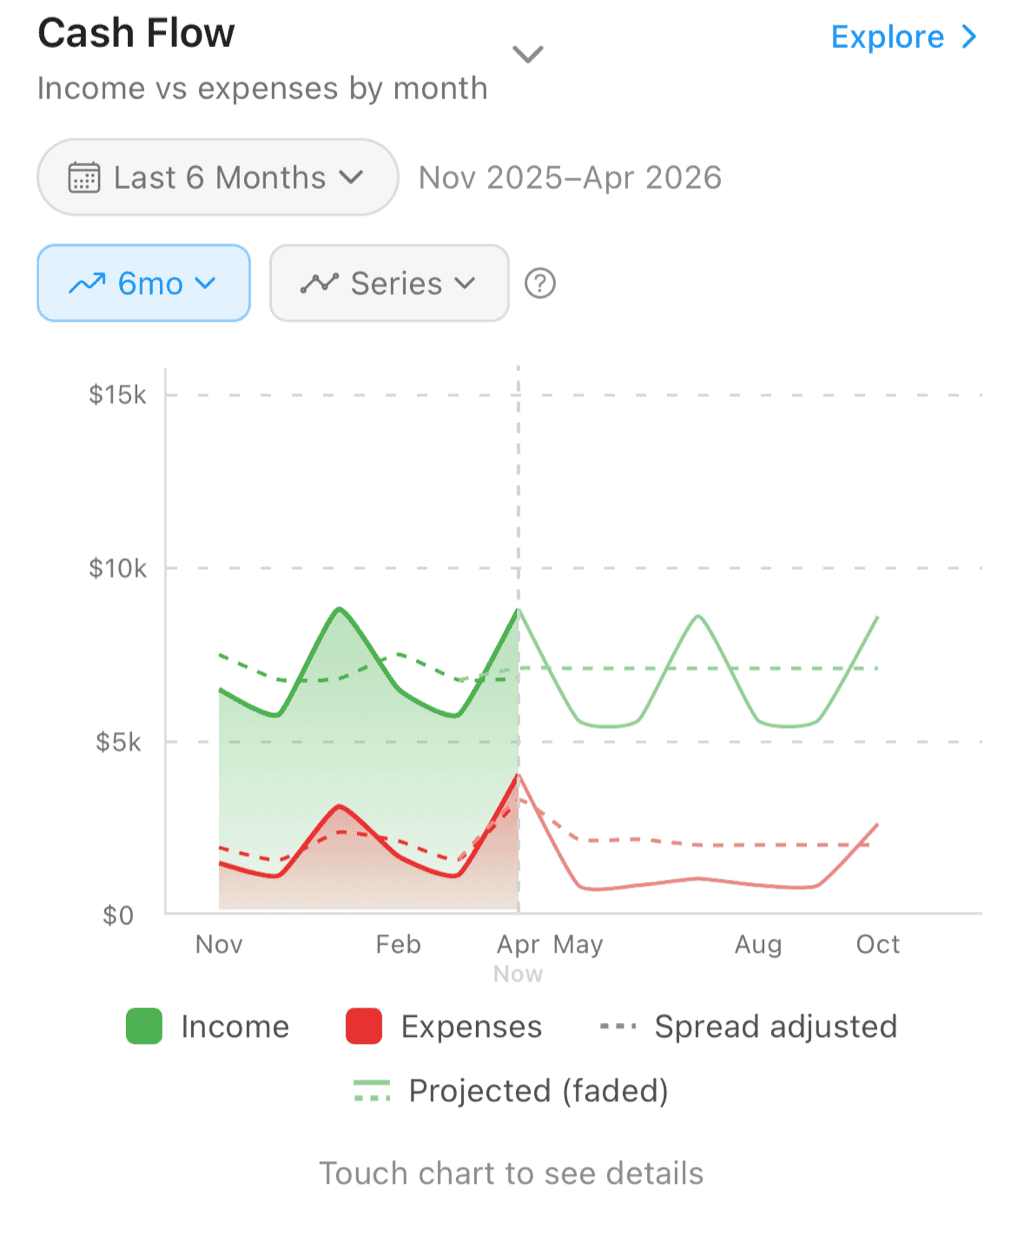
Six months of history followed by six months of projection. Solid lines show actual income and expenses; dashed lines show spread-adjusted and projected values.
Why Spread-Adjusted Projections Help
Take a simple example. Say Alex has a $2,400 annual bonus and a $600 car insurance payment that hits twice a year. In a month where the insurance lands, the raw cash flow looks grim — $600 of unexpected expense. The bonus month looks great. Every other month sits somewhere in between with no obvious pattern.
With spread rules in place, the same activity tells a different story:
- The $2,400 bonus, distributed backward across 12 months, becomes +$200/month of effective income.
- The $600 insurance, spread across 6 months, becomes -$100/month.
- Net: +$100/month of irregular activity, smoothly applied across every month.
Spreading helps you see whether you are on track in a net financial sense when looking at any individual month — instead of being fooled by which lump sums happened to clear that calendar window.
How Projections Appear
Projected lines appear as muted, lighter-colored versions of your income and expense lines, extending beyond a "Now" divider that marks the boundary between historical data and projections.
What you see depends on your Series Mode:
| Series Mode | Projection Lines Shown |
|---|---|
| Actual | Projected actual income and expenses |
| Spread Adjusted | Projected spread-adjusted income and expenses |
| Both | Both actual and spread-adjusted projection lines |
When you have spread rules active, the "Both" mode shows four projection lines total—actual and spread-adjusted for both income and expenses—so you can compare how spreading affects each series.
How the Average Is Calculated
Both projection lines start from a weighted average of all historical months in your selected date range. Each complete month gets a weight of 1.0, but the current (partial) month is weighted by the fraction of days elapsed.
Example: Say you're viewing the last 3 months (January through March 15):
- January: $4,000 expenses (weight 1.0)
- February: $3,500 expenses (weight 1.0)
- March 1–15: $1,800 expenses so far (weight 15/31 ≈ 0.48)
Without partial-month weighting, March's $1,800 would drag the average down to $3,100. With weighting, the average reflects the full-month rate: roughly $3,750—which is closer to what you'd actually expect for a complete month.
One-Time Spread Exclusion
If you have a one-time spread rule—for example, spreading a single $6,000 car repair over 6 months—those transactions are excluded from the actual projection average. Since that $6,000 expense won't recur, including it would inflate your projected expenses going forward.
This only affects the "actual" projection line. Spread-adjusted projections handle one-time spreads differently (see below).
Actual Projections — Bumpy
The actual projection line shows when you expect to actually see money move. It takes the base average and adds expected lump-sum amounts from recurring spread rules in the specific months they're due.
Example: You have a quarterly water bill of $450 due every 3 months. Instead of showing a flat $150/month, the actual projection shows:
- Months without the water bill: just your base spending average
- Months when it's due: base average + $450 spike
This creates a "bumpy" line that reflects real cash flow — the months where larger bills actually hit your account.
Spread-Adjusted Projections — Smoother
The spread-adjusted projection distributes those same expected recurring transactions across their spread periods, creating a smoother line. Each projected transaction's amount is divided evenly across the months in its spread window, just like spread rules work for historical transactions.
Example: That same quarterly $450 water bill (spread over 3 months) appears as ~$150/month in the spread projection — much smoother than the bumpy actual line.
When you have no spread rules, both projection lines show the same values.
Current Month Overlap
The projection starts at the current month, overlapping with your partial actual data for the month. This creates a smooth visual transition from what has actually happened so far to what the chart projects for the rest of the period. The projected value for the current month represents the full-month average, not just what you've spent or earned so far.
Projections and Filters
Projections respect your current filters. If you filter to a specific category like "Groceries," the projection is based only on your historical grocery spending. This makes it easy to answer questions like "how much will I likely spend on groceries next month?"
Budget lines and projections can be viewed together—turn on budget lines to see how your projected spending compares to your budget.
Projection Breakdown
When you tap on a projected month, a collapsible Projection breakdown section appears in the period details. This shows exactly which recurring rules contribute to that month's projected amount:
- Each rule shows its name, amount, and frequency (monthly, quarterly, semi-annually, annually)
- Helps you understand why a specific month's projection is higher or lower than average
- Especially useful for "bumpy" actual projections where large recurring bills cause spikes
Exploring Projected Months
The Explore button is available for projected months, not just historical ones. When you tap Explore on a projected month, the Explorer shows spread-adjusted synthetic groups for future months — the same recurring transactions that contribute to the projection, distributed across their spread periods. This lets you see the specific rules and amounts that make up a projected month's total.
Using Cash Flow Effectively
Monthly Health Check
- Select "This Month"
- Check if income exceeds expenses
- Compare to last month
- Note any unusual spikes
Identify Patterns
- Select "Last 12 Months"
- Look for seasonal expense spikes (holidays, summer, etc.)
- Check income consistency
- Plan for predictable variations
Track Progress
- Compare this year to last year
- Are you spending less? Earning more?
- Is your net cash flow improving?
- Celebrate wins, address problems
Budget Performance
- Turn on budget lines
- See how actual spending tracks
- Identify months you exceeded budget
- Adjust future budgets based on patterns
Common Insights
Paycheck-to-Paycheck Pattern
If expenses closely follow income with little gap:
- Consider building an emergency fund
- Look for expenses to reduce
- Automate savings
Seasonal Variation
Spikes at certain times of year:
- Holiday spending in December
- Summer vacation expenses
- Back-to-school in August
- Plan and budget for these
Income Variability
For irregular income (freelance, commission):
- Look at 6-12 month averages
- Budget based on low months
- Save during high months
Expense Creep
Gradually increasing expenses:
- Compare year-over-year
- Identify growing categories
- Review subscriptions and recurring costs
Troubleshooting
Income Appears as Expenses
- Check category settings—is it marked as income?
- Verify the transaction amount sign (positive = income)
- Review uncategorized transactions
Numbers Don't Match Expectations
- Check for excluded accounts
- Verify transfers are correctly identified
- Look for pending transactions
- Check date range includes all relevant transactions
Budget Lines Missing
- Ensure budgets exist for the filtered categories
- Check that budget periods overlap with the date range
- Verify budget settings are configured
Chart Looks Empty
- Expand the date range
- Check filters aren't too restrictive
- Verify accounts are connected and synced
Related Features
- Explorer - Drill down into specific categories
- Budgets - Set spending limits visible in reports
- Implied Budgets - How filters affect budget lines
- Transfer Detection - Why transfers don't appear
- Spread Transactions - How spread rules affect projections
- Categories - How transactions are classified